Road Service Dashboard
When a truck breaks down, every minute counts. I designed the tool that gets drivers back on the road faster.
ClientC.R. England
RoleLead Product Designer
DurationMulti-phase engagement
Year2024
When a truck breaks down, every minute counts. I designed the tool that gets drivers back on the road faster.
When a truck breaks down mid-route, the repair bill is the smallest part of it. There's the missed delivery, the stranded driver, and the schedule changes that ripple out across the fleet. I designed the incident management system that gets drivers back on the road faster.
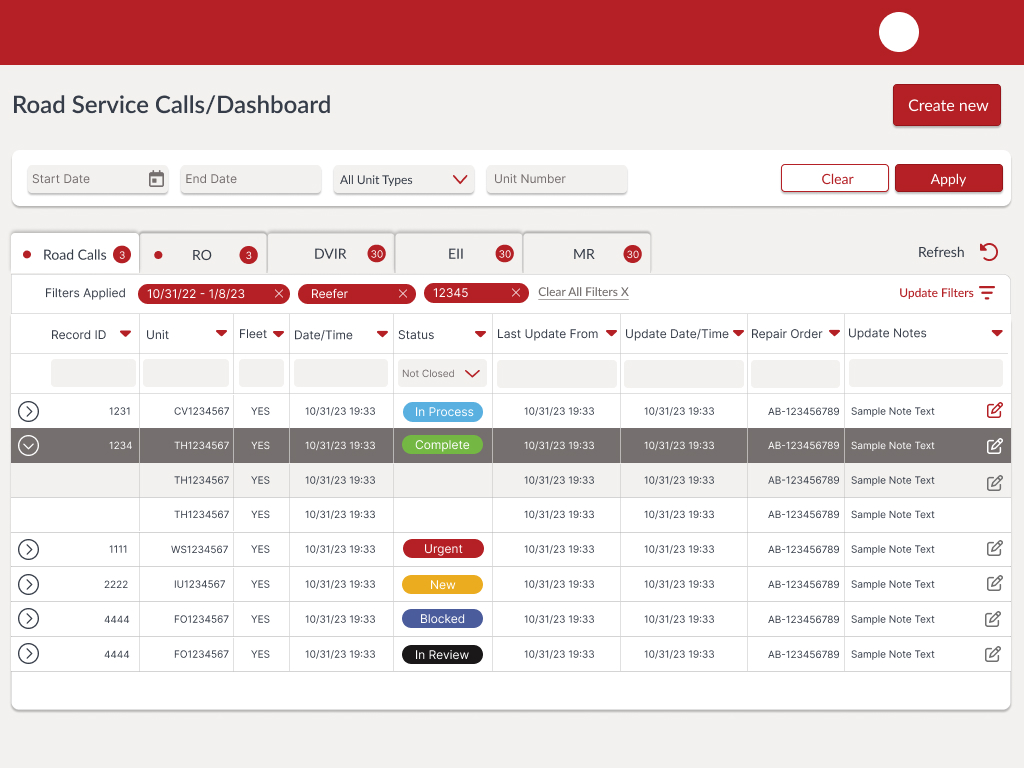
When a truck breaks down on the road, multiple teams need to coordinate fast, and the legacy system made that nearly impossible. Incident status meant something different depending on which team you asked. Ownership changed hands without a clear handoff. Urgent cases competed visually with low-priority ones, so the cluttered interface was hard to scan under pressure, and critical workflows were spread across multiple tools with no shared sense of priority or next action. Every delay in triage meant a stranded driver, a missed delivery, and rising costs.
Made ownership and status explicit at every level. No ambiguous states, no unclear handoffs.
Consolidated three separate tools into a single triage surface to eliminate context switching.
Prioritized visual hierarchy that surfaces urgency at a glance. High-pressure ops teams can't afford to hunt for information.
Built vendor rating into the workflow to create accountability and quality tracking over time.
Delivered a centralized incident dashboard that reduced triage time and improved cross-team coordination. Manual follow-up dropped off significantly once status and ownership became explicit and visible to everyone involved. The bigger lesson, honestly, was that clarity beats density in high-pressure operations. Most of the decisions that actually helped here were about what to cut, not what to add.
Incident dashboard — main list view. The primary triage surface. Surfaced urgent incidents at a glance across the full fleet, with status, priority, and ownership visible without opening a record. Designed for high-pressure, eyes-on-screen ops environments.
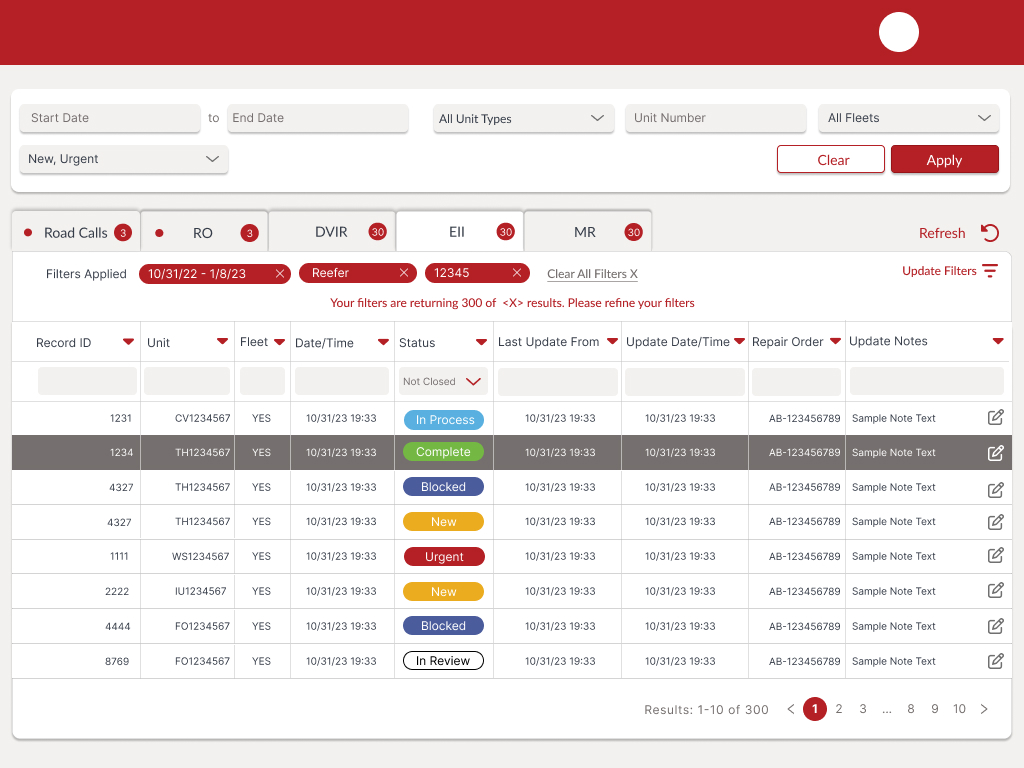
Event detail form. Structured data capture for each roadside incident — equipment type, damage, out-of-order status, and photo documentation. Designed to reduce incomplete submissions.
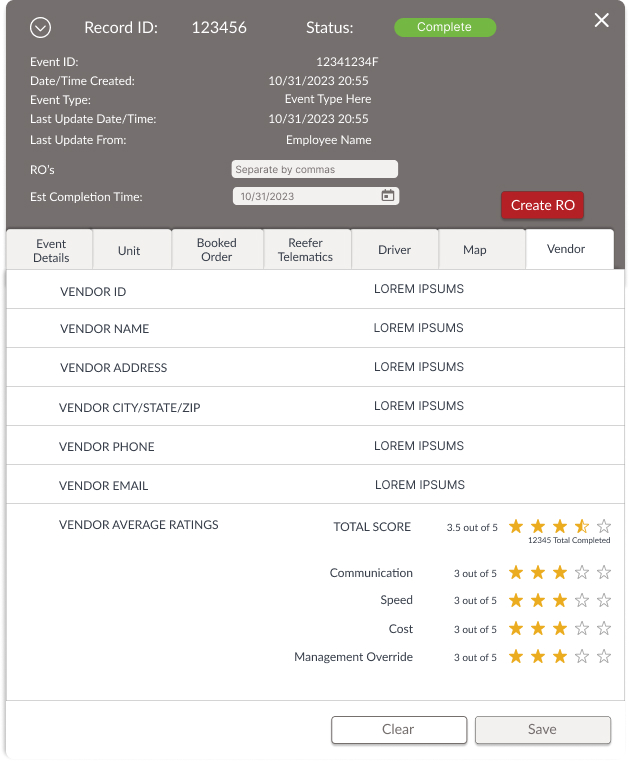
Record detail + status. Full incident record with driver info, vendor assignment, and status tracking. Clear ownership and next-action visibility across dispatch, maintenance, and roadside teams.
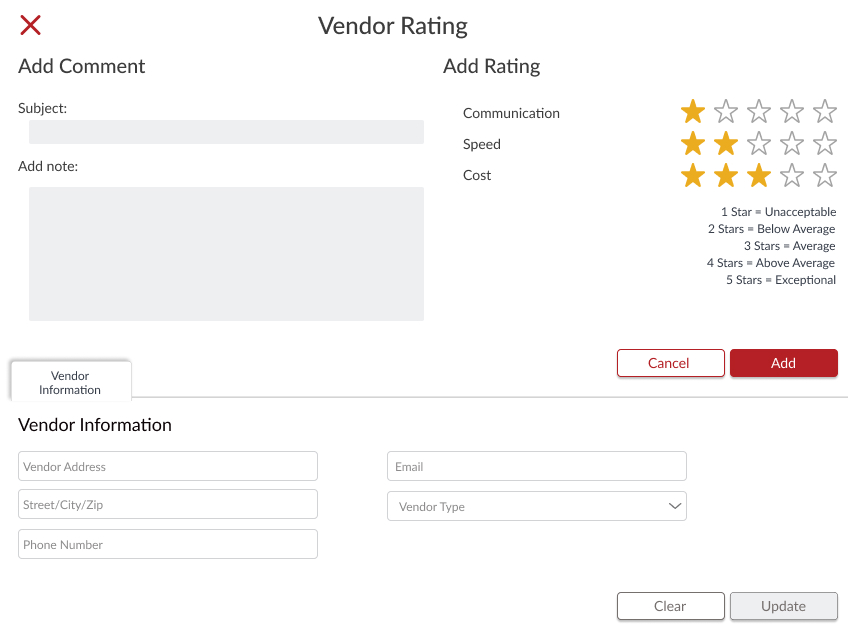
Vendor rating panel. Post-incident vendor evaluation across communication, speed, and cost. Built to create an auditable quality record for vendor management decisions over time.
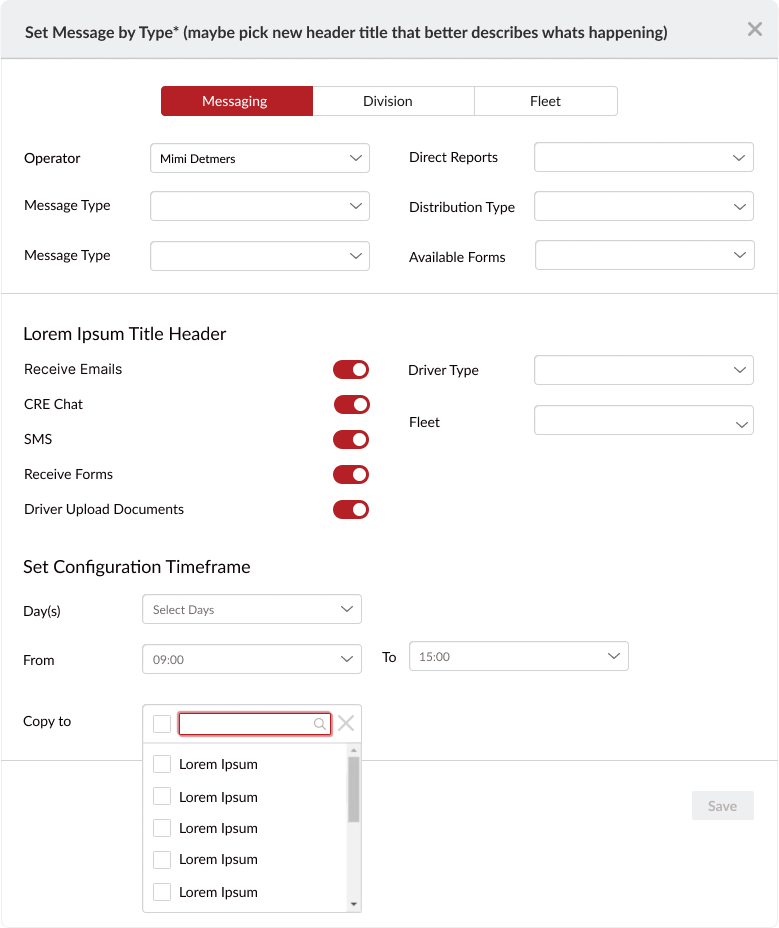
Messaging configuration. Cross-team notification routing — configurable by operator, message type, and distribution. Reduced manual follow-up by establishing clear escalation paths.